
BD CellView™ Image Technologyは、フローサイトメトリーのデータと画像をリアルタイムで組み合わせたテクノロジー(RTI)です。この技術により、細胞の増殖や機能、相互作用、さらには細胞内のウイルスやタンパク質の位置を迅速に調べることが可能になります。各イベントの画像とフローデータはシームレスに統合し、データの取得中にイベントの画像を簡単に表示させることができます。リアルタイムイメージングによるターゲット細胞のリアルタイムでの画像取得および画像情報に基づく新たなゲーティングストラテジーは、従来のセルソーターの機能を向上させ、高精度なターゲット細胞の解析とソーティングを可能にします。
BD CellView™ Image Technologyとカメラベースのイメージングサイトメトリーの比較
カメラを使用するイメージングとフローサイトメトリーを組み合わせた技術とは異なり、BD CellView™ Image Technologyはカメラを使用しないため、はるかに高速でのイメージングが可能です。カメラベースの技術は、厳密に制御された流体力学に依存しており、高速のドロップレットセルソーティングには使用できません。BD CellView™ Image Technologyは、フローサイトメーターで既に使用されている電子・光学コンポーネントを使用して、直交周波数分割多重化(OFDM)という方法を取り入れています。この方法により、カメラベースの技術よりも、高速なスループットが可能になります。サンプルの取得時に、画像データをリアルタイムで高速に取得および定量化し、解析およびソーティングを行うことができます。
Principles of BD CellView™ Image の原理

Eccentricity(離心率)
分析領域内の特定パーティクル分布の最短軸と最長軸の比率
使用例:ダブレット識別、クラスター識別
すべての画像チャネルにて使用可

Max Intensity(最大輝度)
分析領域に関わらず、イメージ内の最も明るいピクセルの輝度
使用例:点状の蛍光分布、貪食アッセイ、細胞周期解析
すべての画像チャネルにて使用可

Size(サイズ)
イメージ内の設定した(ピクセル)閾値より明るいピクセル数
使用例:未標識ソーティング、点状の蛍光
すべての画像チャネルにて使用可

Radial Moment(ラジアルモーメント)
分析領域の中心からのピクセル平均距離
使用例:偏心を用いたダブレット識別、細胞間相互作用(細胞シナプス)
すべての画像チャネルにて使用可

Correlation(相関)
解析領域で定義された2つの蛍光画像チャンネルの領域が同じである度合
使用例:転位解析(トランスロケーション解析)
任意の2つの蛍光画像チャネルで使用可

Delta Center of Mass(デルタセンターオブマス)
分析領域内における2つの蛍光イメージパーティクルの距離
任意の2つの蛍光画像チャネルで使用可

FSC(前方散乱光)
粒子(細胞)がレーザーを通過するとき、光と粒子の相互作用により、光はあらゆる方向に散乱します。
前方散乱光の検出器は、レーザー光路上に設置され、わずかな角度に散乱した光を測定します。前方散乱は、粒子(細胞)サイズと近い相関性を示します。
")
SSC(側方散乱光)
粒子(細胞)がレーザーを通過するとき、光と粒子の相互作用により、光はあらゆる方向に散乱します。
側方散乱光の検出器は、レーザー光路に対して垂直(90°)に散乱する光を測定します。側方散乱光は、粒子の内部の密度または複雑さと近い相関性を示します。
")
Light Loss (ライトロス)
粒子(細胞)がレーザーを通過するとき、光と粒子の相互作用により、光はあらゆる方向に散乱します。
ライトロスの検出器は、粒子(細胞)による光の散乱や吸収によって、レーザーから失われた光子を測定します。
")
Using Image Features to Measure the Relative Location of Fluorescence Signals and Track Morphological Changes in Cell Populations
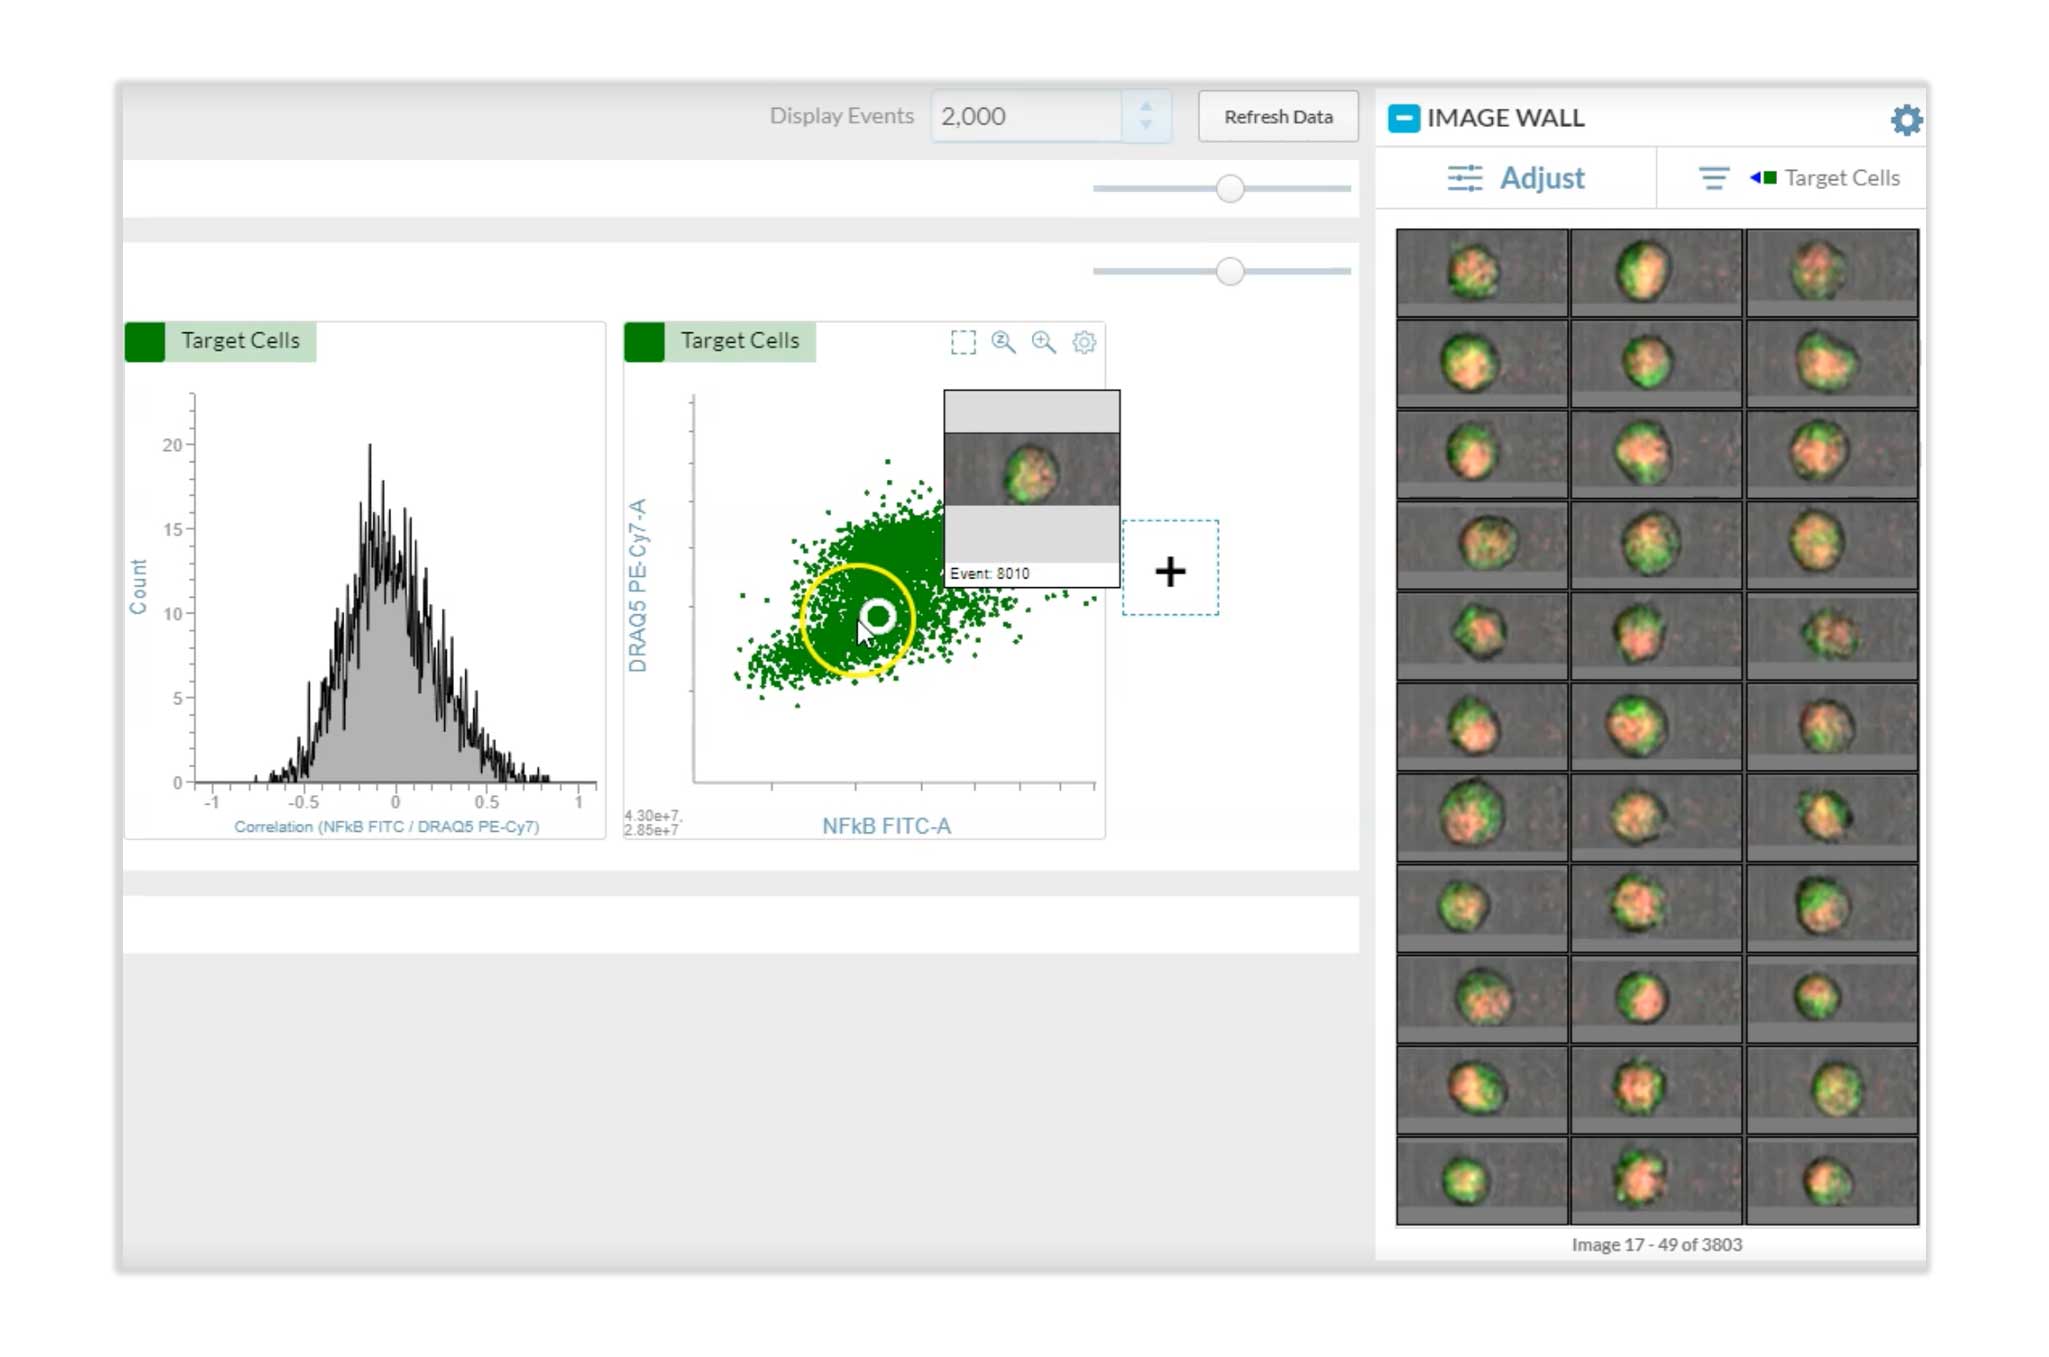
HT-1080 fibrosarcoma cells were treated with TNF-a and then subsequently fixed, permeabilized and stained for p65 (NFκB) using a secondary FITC-labeled antibody. The cells were then counterstained with the DNA stain DRAQ5™. BD CellView™ Image Technology enables the measurement of the relative spatial correlation between the NFκB FITC signal and the DNA DRAQ5™ signal. A correlation score of 1 indicates that both signals occupy the same space spatially.
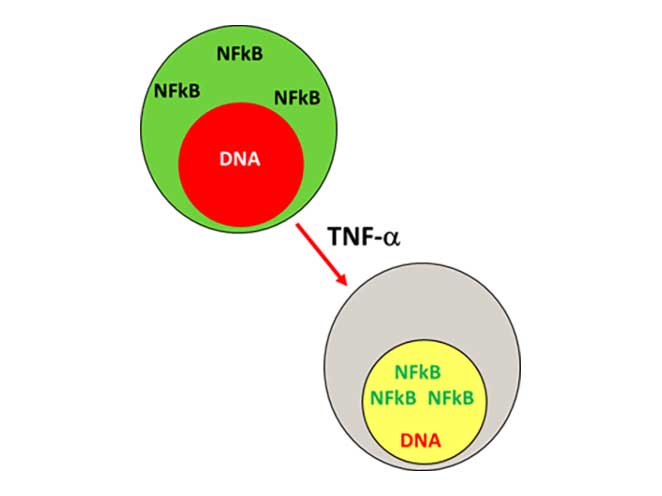
Real-time image feature analysis measures the spatial correlation between two fluorescent signals.
-DNA-Thumbnail.jpg)
TNF-a titration of HT-1080 fibrosarcoma cells demonstrates varying degrees of translocation. The correlation score measures the relative degree of translocation.
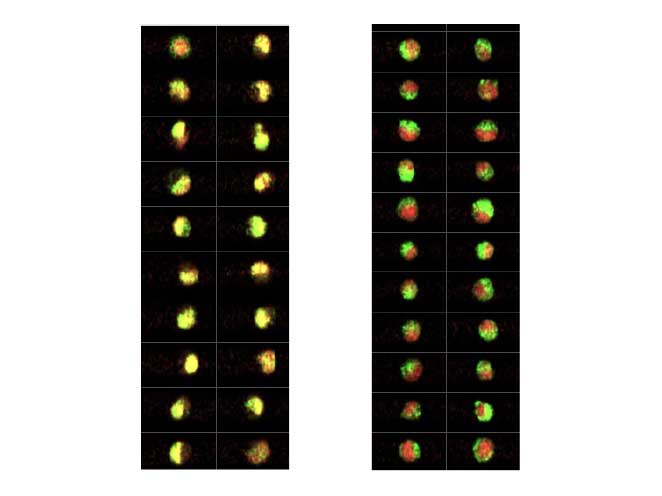
Increasing concentrations of TNF-a induce translocation of NFκB from the cytoplasm into the nucleus. The green fluorescence signal of NFκB and the red fluorescence signal of the DNA merge to appear yellow.
Doublet Discrimination Using Imaging Features to Bolster Purity
Doublet and clump exclusion is a critical preliminary step in establishing a pure sort. Doublets can confound purity and can lead to unwanted results or unnecessary expense when performing downstream functional and/or genomic analyses. Here we sought to demonstrate the improvements in doublet discrimination that an image enabled sorter can offer. Peripheral blood mononuclear cells (PBMCs) were prepared by Ficoll™ separation from five healthy donors. Sample preparations were counterstained with DRAQ5™, a membrane permeable, DNA intercalating dye that is compatible with BD CellView™ Image Technology. Doublet frequency was tracked via DNA content as traditional scatter-based doublet discrimination strategies were compared with an image-based approach. Singlet vs non-singlet (doublets and clumps) content in each gate was compared.
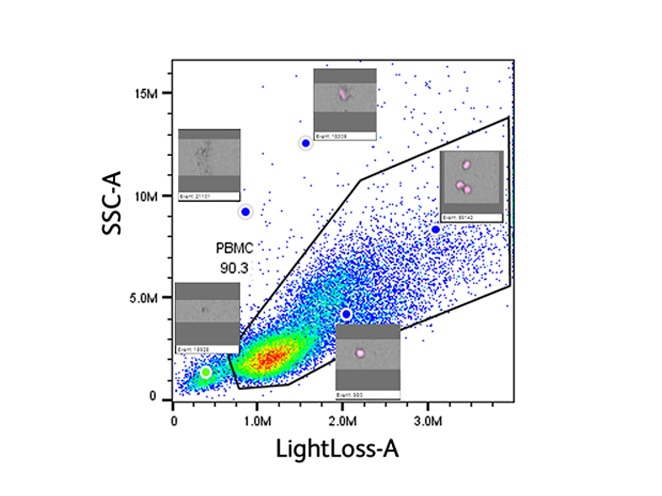
BD CellView™ Image Technology generated image features can be used to identify and exclude doublets. The mouse-over function enables accurate gate placement.
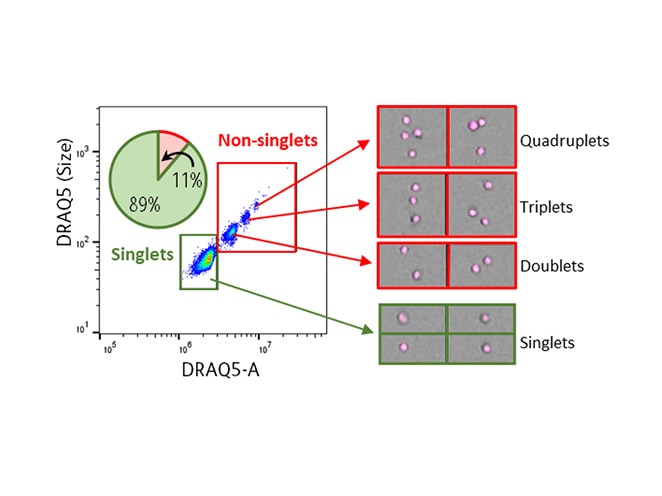
DRAQ5™ DNA dye is used to track the singlet vs non-singlet content inside and outside of each gate defined during the doublet exclusion workflow.
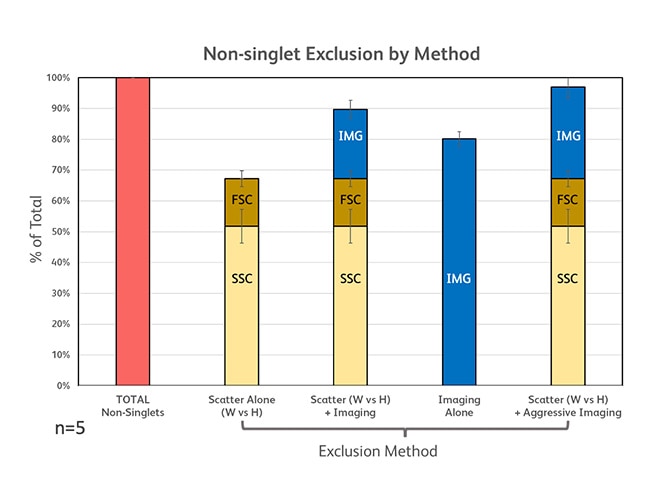
The percentage of doublets excluded, and the percentage of singlets preserved is compared across several doublet exclusion strategies.
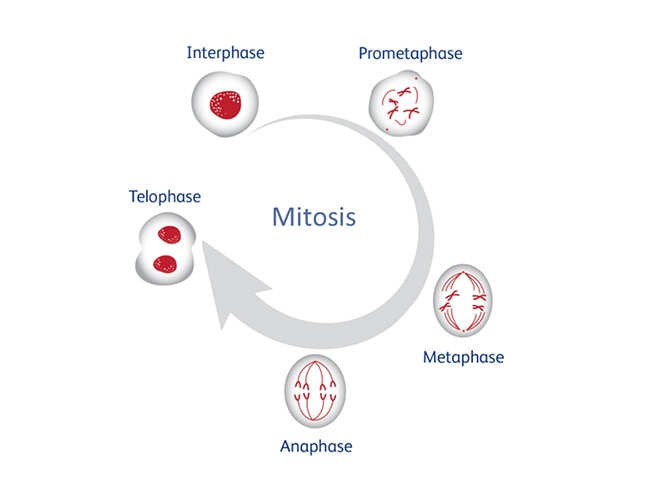
Identifying all stages of cell cycle using imaging features
Each of the five stages of mitosis—interphase, prometaphase, metaphase, anaphase and telophase—are characterized by a particular chromosomal morphology and/or cell shape that can be used to separate these stages.
HeLa cells expressing neon green histone H2B were used to evaluate each of the five phases of mitosis.

Fluorescence (Area) parameters were coupled with several image features to establish a gating strategy to identify cells at interphase, prometaphase and metaphase.

HeLa cells at anaphase and telophase were identified using a combination of fluorescence (Area) parameters and image features.
Measuring translocation:
HeLa cells expressing fluorescently tagged NFκB with DRAQ5™ DNA counterstain

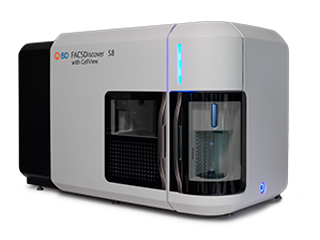
BD CellView™ Image TechnologyとBD SpectralFX™ Technologyの組み合わせ
BD FACSDiscover™ S8 セルソーターは、BD CellView™ Image Technologyと BD SpectralFX™ Technologyを使用し、スペクトルフローサイトメトリーとリアルタイムの空間的および形態的洞察を組み合わせています。 このセルソーターは以下の機能を提供します:
The cell sorter:
- 解析およびソーティング中に細胞集団と特性に関する洞察をリアルタイムで視覚的に確認できます。
- 空間的および形態的洞察を活用して、以前は識別や分離ができなかった細胞タイプを分析および分類します。
- ソフトウェアでのイメージング機能、より柔軟なパネルデザイン、自動化機能により、ワークフローを簡素化します。
- 画像データと従来のフローデータを関連付けることで、非常に複雑な疾患やシステムの包括的なプロファイルを作成できます。
本製品は研究用です。疾病の診断・治療または予防に使用することはできません。